
Syllabus
Sample means
4.3.1 examine the concept of the sample mean 


4.3.2 simulate repeated random sampling, from a variety of distributions and a range of sample sizes, to illustrate properties of the distribution of 


4.3.3 simulate repeated random sampling, from a variety of distributions and a range of sample sizes, to illustrate the approximate standard normality of 

Confidence intervals for means
4.3.4 examine the concept of an interval estimate for a parameter associated with a random variable
4.3.5 examine the approximate confidence interval 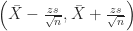
4.3.6 use simulation to illustrate variations in confidence intervals between samples and to show that most but not all confidence intervals contain
4.3.7 use 
Lessons
1. Sample mean as a random variable
2. Distribution of sample means
Khan academy https://www.khanacademy.org/math/probability/statistics-inferential/sampling-distribution/v/central-limit-theorem. Work through the sequence of five videos. The onlinestatbook simulator referenced can be found at http://onlinestatbook.com/stat_sim/sampling_dist/.
3. Standardised sample means
We can use the sample standard deviation as an estimator of population standard deviation and this allows us to model the sampling distribution of the mean as a normal distribution with standard deviation equal to the sample standard deviation, and unknown mean. The whole point of this is to allow us to draw inferences about the population mean.
In class we will view a simulator that shows how the means of samples can be used to approximate a normal distribution using 
4. Interval estimates
5. Confidence interval for the mean of a random variable
Khan academy https://www.khanacademy.org/math/probability/statistics-inferential/confidence-intervals/v/confidence-interval-1. Work through the sequence of three videos. EDIT: These videos are about confidence interval for population proportion, and so more relevant to the Methods course than the Specialist course.
6. Estimating population mean and standard deviation
Other resources
- HyperStat Online. Chapters 6 and 8 are relevant. (Other parts may be relevant for the work in Mathematics Methods.)
-
Sampling Distribution of the Sample Mean from the Wolfram Demonstrations Project by Jim R Larkin
